I have been writing about how to target BPhO Super Gold for a while. This post addresses the separate question: once you have a BPhO result, how much does it actually move the needle in US undergraduate admissions? The data here is incomplete and should be read as directional rather than definitive.
The Core Data Points
BPhO Super Gold
In recent years, Super Gold represents approximately the top 6–10% of participants, with scores in the range of 40–50 points. The number of students achieving this award is around 180 per year. Working backward: 180 divided by 6% gives roughly 3,000 participants — about 300 fewer than the official registered count, which is consistent with blank submissions, disqualifications, and non-completions.
US Admissions Class Profile Data
A subset of US universities publish the percentage of enrolled students who ranked in the top 10% of their high school class. This data has significant noise — many schools do not rank students, and many universities do not publish it — but the directional picture is:
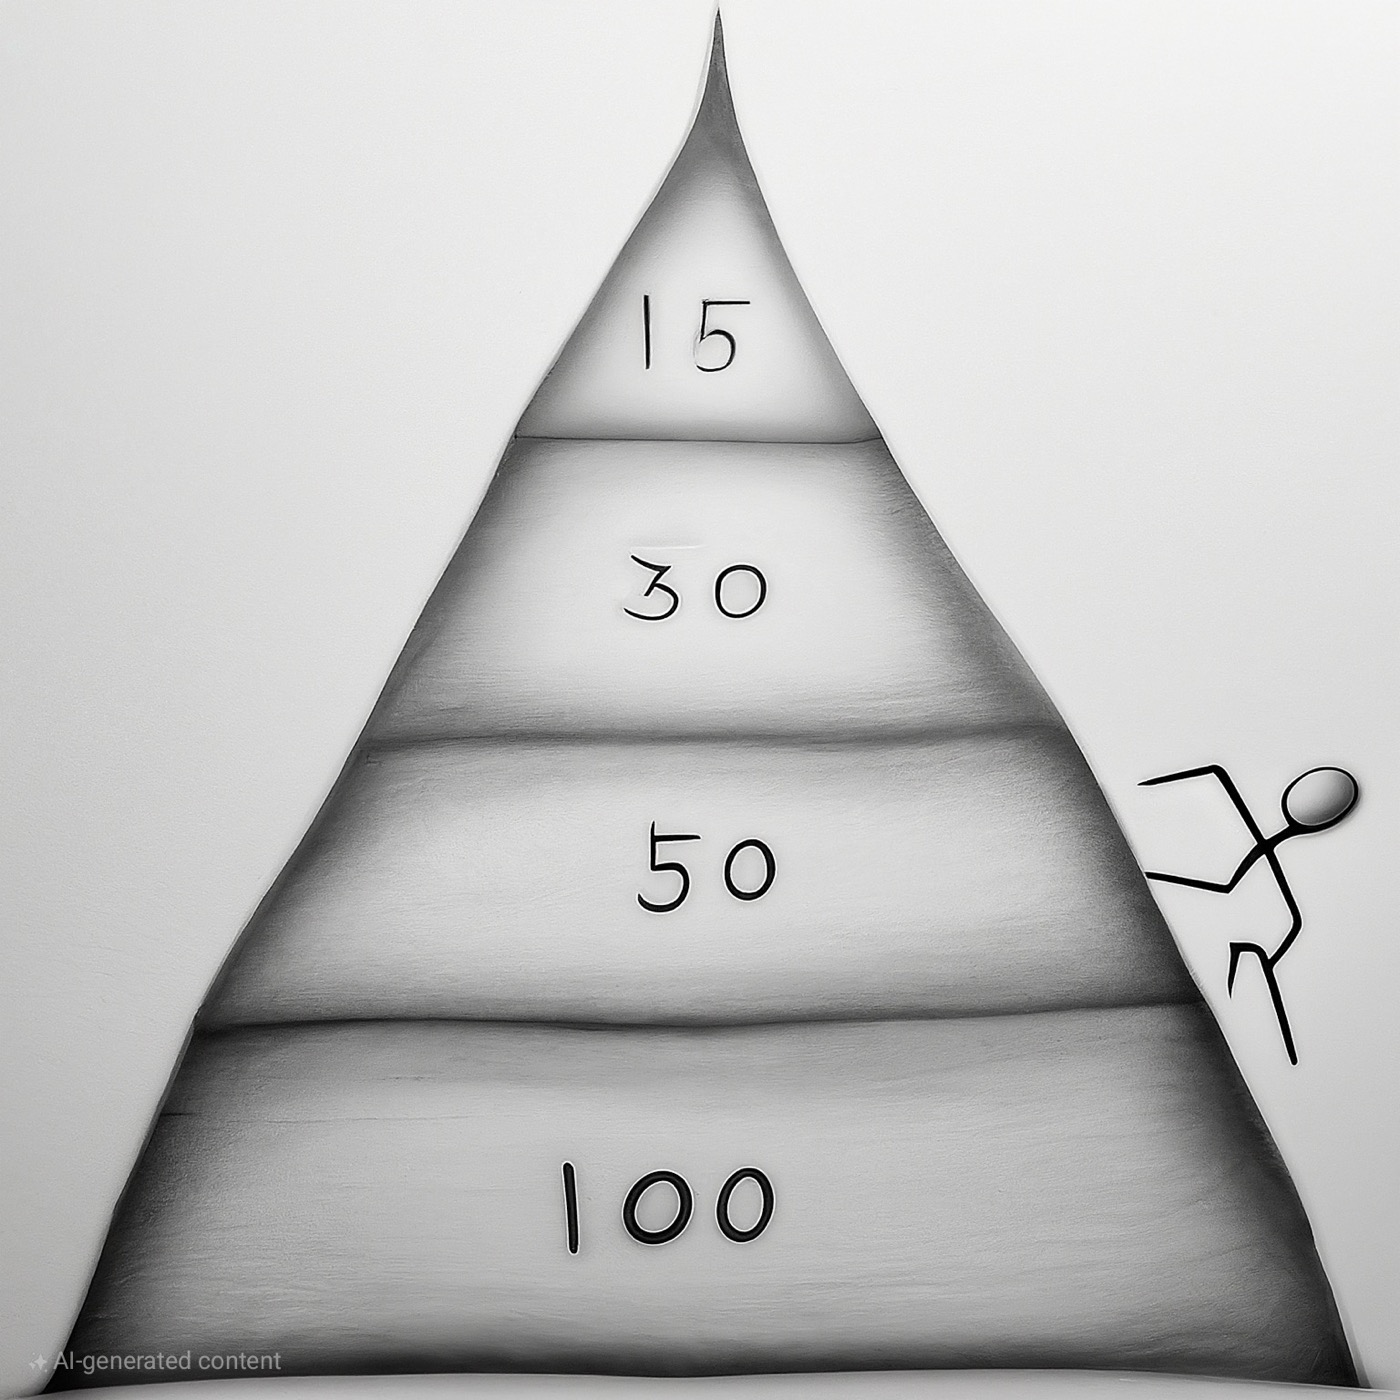
- T15 universities: approximately 95% of enrolled students were in the top 10% of their high school class. Cornell is notably lower at around 80%, which pulls down the group average.
- Rank 15–30: approximately 86% were top-10% students.
- Rank 30–50: this falls to around 64.5%.
Putting It Together: BPhO Award Value by School Tier
Super Gold places you roughly in the top 10% of physics students who sat the exam. That maps reasonably well onto the admissions profile of competitive US universities. Here is the working framework:
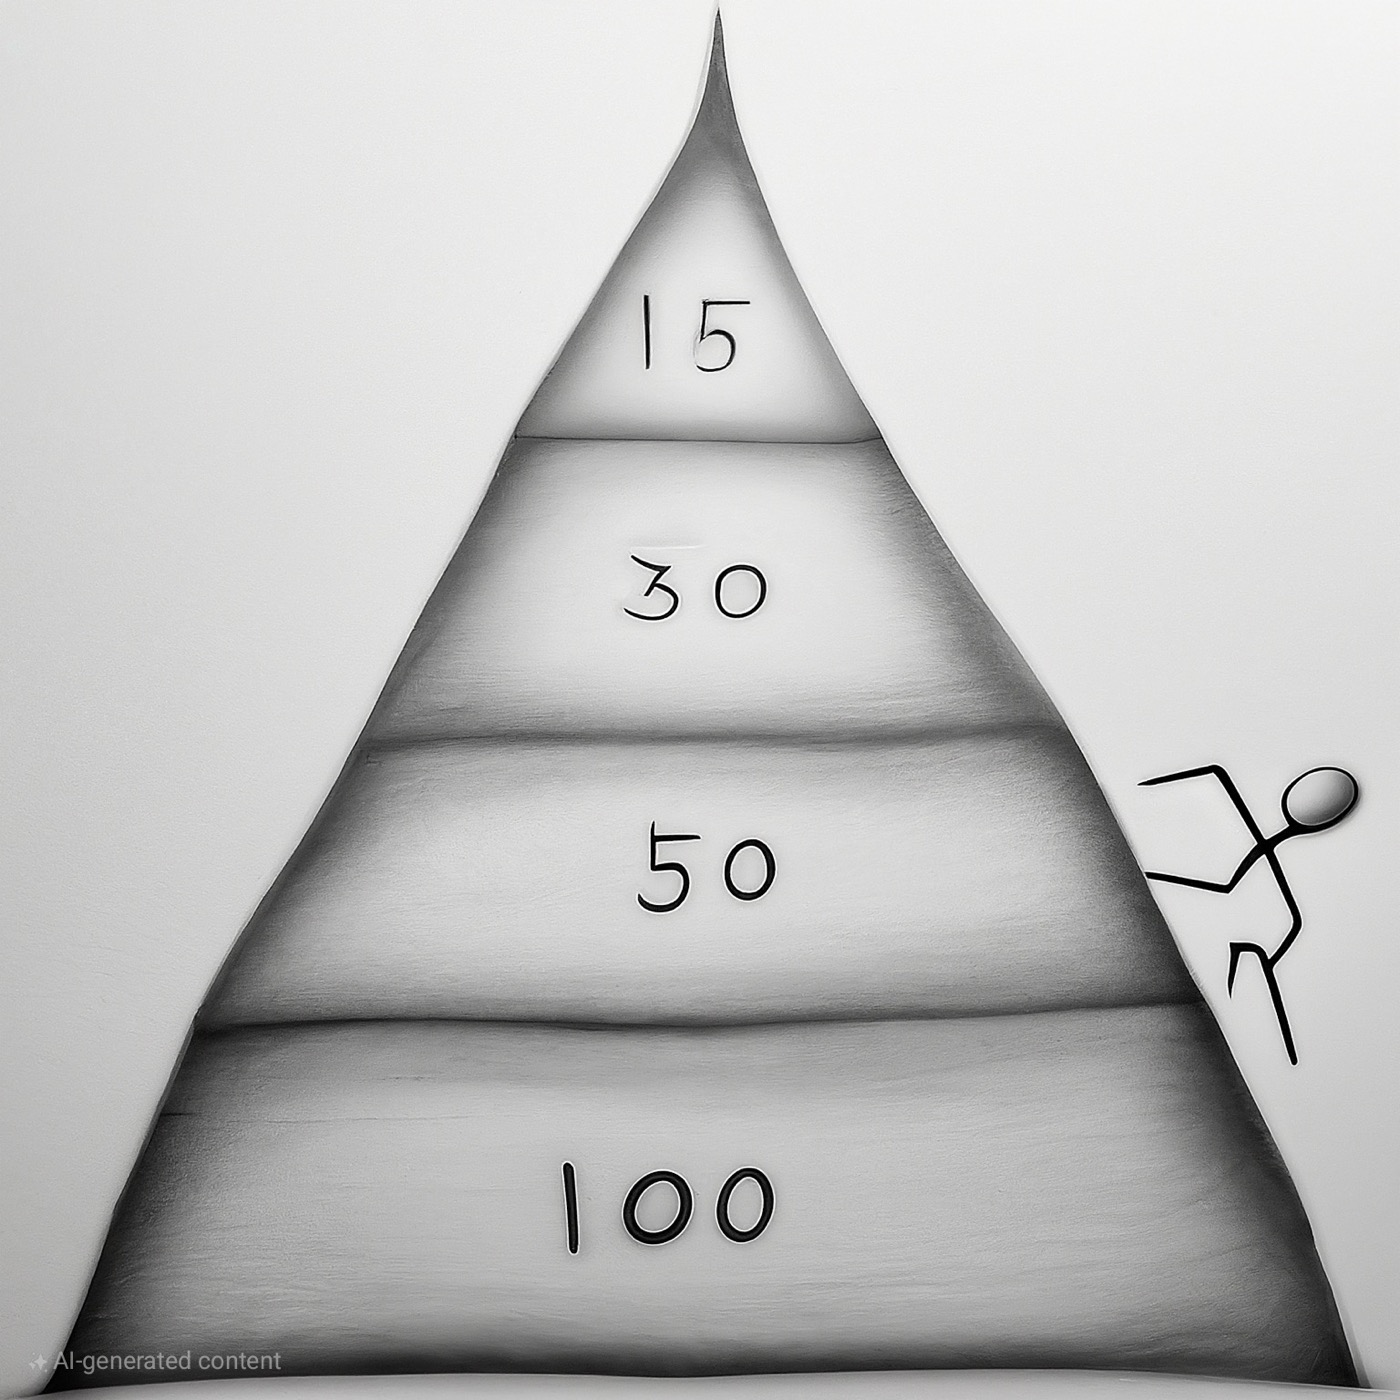
- HYPSM and equivalents: Round 1 Super Gold is not enough. You need Round 2 Gold — and even then, it may not be decisive. MIT, for example, tends to admit physics-track students who have medaled at IPhO. Super Gold alone does not clear that bar.
- Other T15: Super Gold is expected, not exceptional. For physics majors, Round 2 is still preferable; for engineering and other STEM fields, Round 1 Super Gold is generally sufficient — but it is not a distinguishing factor.
- Rank 15–30: A mild positive. Super Gold adds something, though not dramatically. Round 2 Gold at this level starts to feel unnecessary.
- Rank 30–50: Super Gold is worth including in applications. The benefit is modest but real.
Silver and below: do not list it. The "100% award rate" marketing used by some test prep organizations is exactly that — marketing. An award that goes to most participants signals nothing to an admissions reader.
Adjustment Factors
These general tiers shift based on individual circumstances:
- Mainland China applicants: move one tier up in requirement (competition for spots from China is more intense)
- Pure physics major: move one tier up
- Engineering: move half a tier down
- Life sciences, materials, environmental: move one full tier down (BPhO is less relevant to the field signal you need)
- No award worth listing: Silver minimum — if you cannot reach that, leave it off
A Note on AP Physics 5-Rate Comparison
For context: AP Physics 1 has a 5-rate of approximately 10%; AP Physics 2 around 15%; AP Physics C: Mechanics around 25%; AP Physics C: E&M around 30%. BPhO Round 1 content is concentrated at the AP Physics 1 level. Reaching Super Gold from a solid AP Physics 1 foundation — with some supplementary study — is achievable. The exam is not trivially easy, but it is not out of reach for a student who has already scored 5 on AP Physics 1.